Click to go to the Apple Mac App Store.
 Click to go to the Microsoft Windows Store.
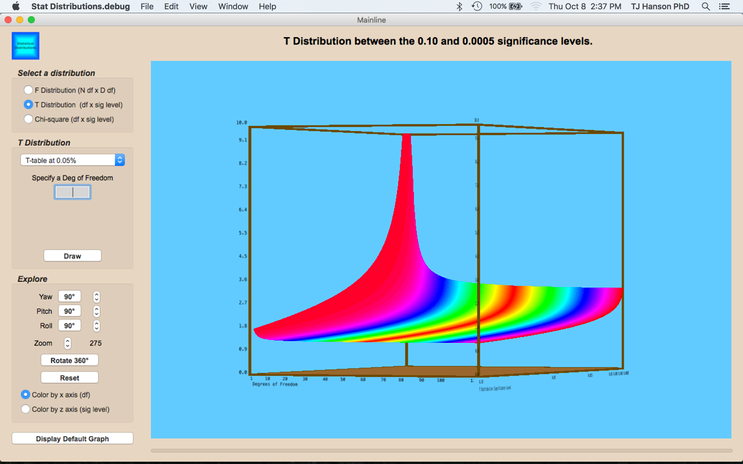
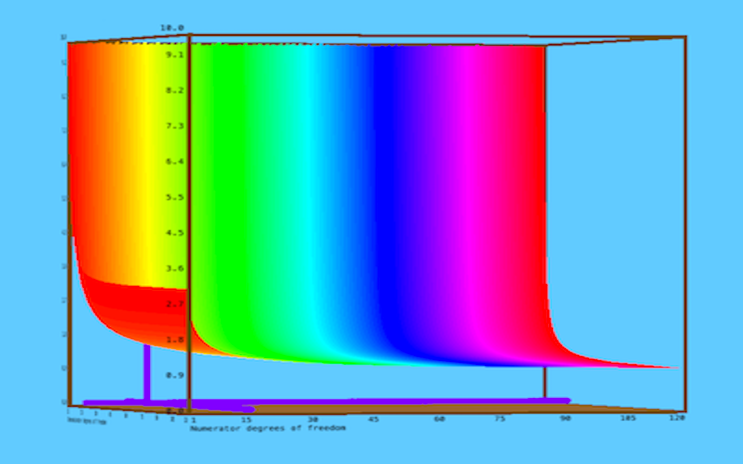
Statistical distributions are usually graphed in two dimensions. Ask any stat student or instructor what the F distribution looks like, or the T distribution, and you will get a standard 2D graph. Even though these 2D representations are correct, they do not provide a true picture of the distribution. That's where this app comes in.
This app will display the true shape fo the F and t distributions at various p-value levels.The user can then enter the degrees of freedom to retrieve the table value; or just click on the graph to display the table value ad degrees of freedom
The purpose or value of this app is as a teaching aid. It complements the other apps in the 'Computational Suite' and helps in the understanding of these statistical distributions.You will find that using a large monitor (say greater than 20 inches) provides a better usage environment for this app..